
During 2017, our Quarterly Mobile Index (QMI) reports focused on some of the fastest growing programmatic monetization technologies and formats. By analyzing over ten trillion advertiser bids flowing each month through PubMatic’s platform, we are able to identify developments that can help advertisers and publishers unleash the power of programmatic for the mobile channel. In this last report of 2017, we expanded our scope to include a full year look back and review the key trends that impacted mobile monetization.
Findings from our Q4 2017 QMI report released today, show that an unmistakable shift in programmatic advertising toward quality brought advertisers’ attention to private marketplaces, with mobile growth outpacing desktop. Header bidding approached maturity as a majority of top 1000 US publishers deployed the technology,1 while mobile video volume trended upward despite the YouTube adjacency scandal that broke out in March 2017, to reach its highest point of the year during the holiday shopping season.
Private Marketplaces (PMP)
As brands shifted more spend to automated channels, nearly three-quarters of CMOs worldwide faced pressure from management to secure brand trust and gain tighter ad controls in 2017.2
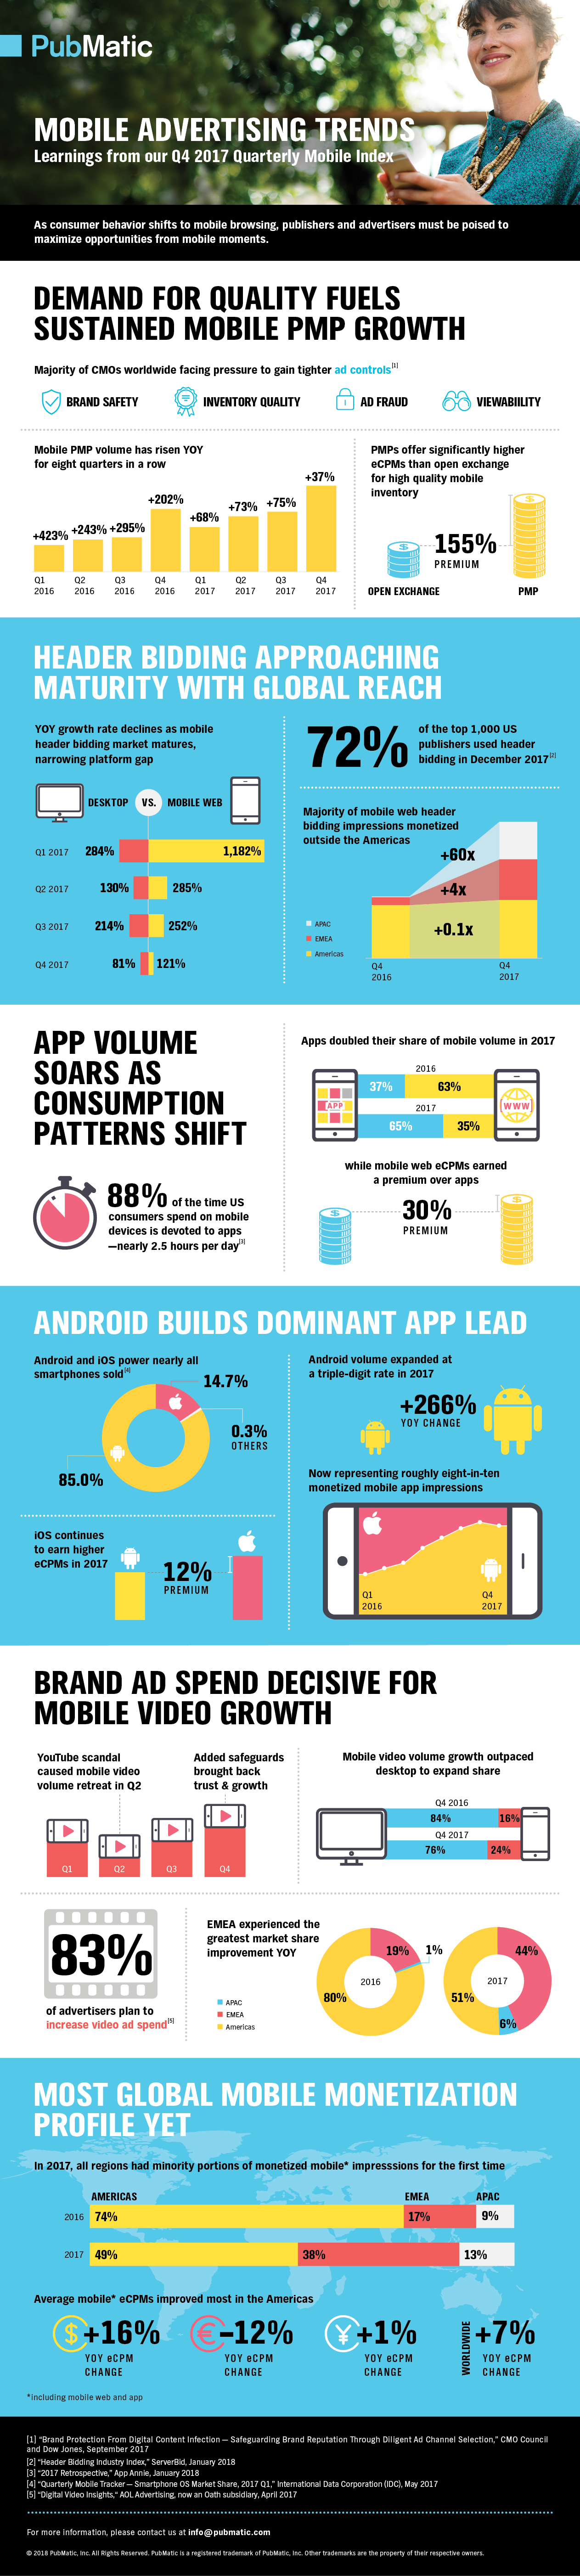
Private marketplaces offer a robust option for advertisers to obtain early access to premium inventory and provide more transparency into where their campaigns run. Combining these capabilities with the need to reach increasingly mobile-first audiences, mobile PMP impression volume rose 37% YOY in Q4 2017. In full year terms, mobile PMP impression growth surpassed 50% YOY in 2017, more than tripling the 15% YOY growth rate for desktop.
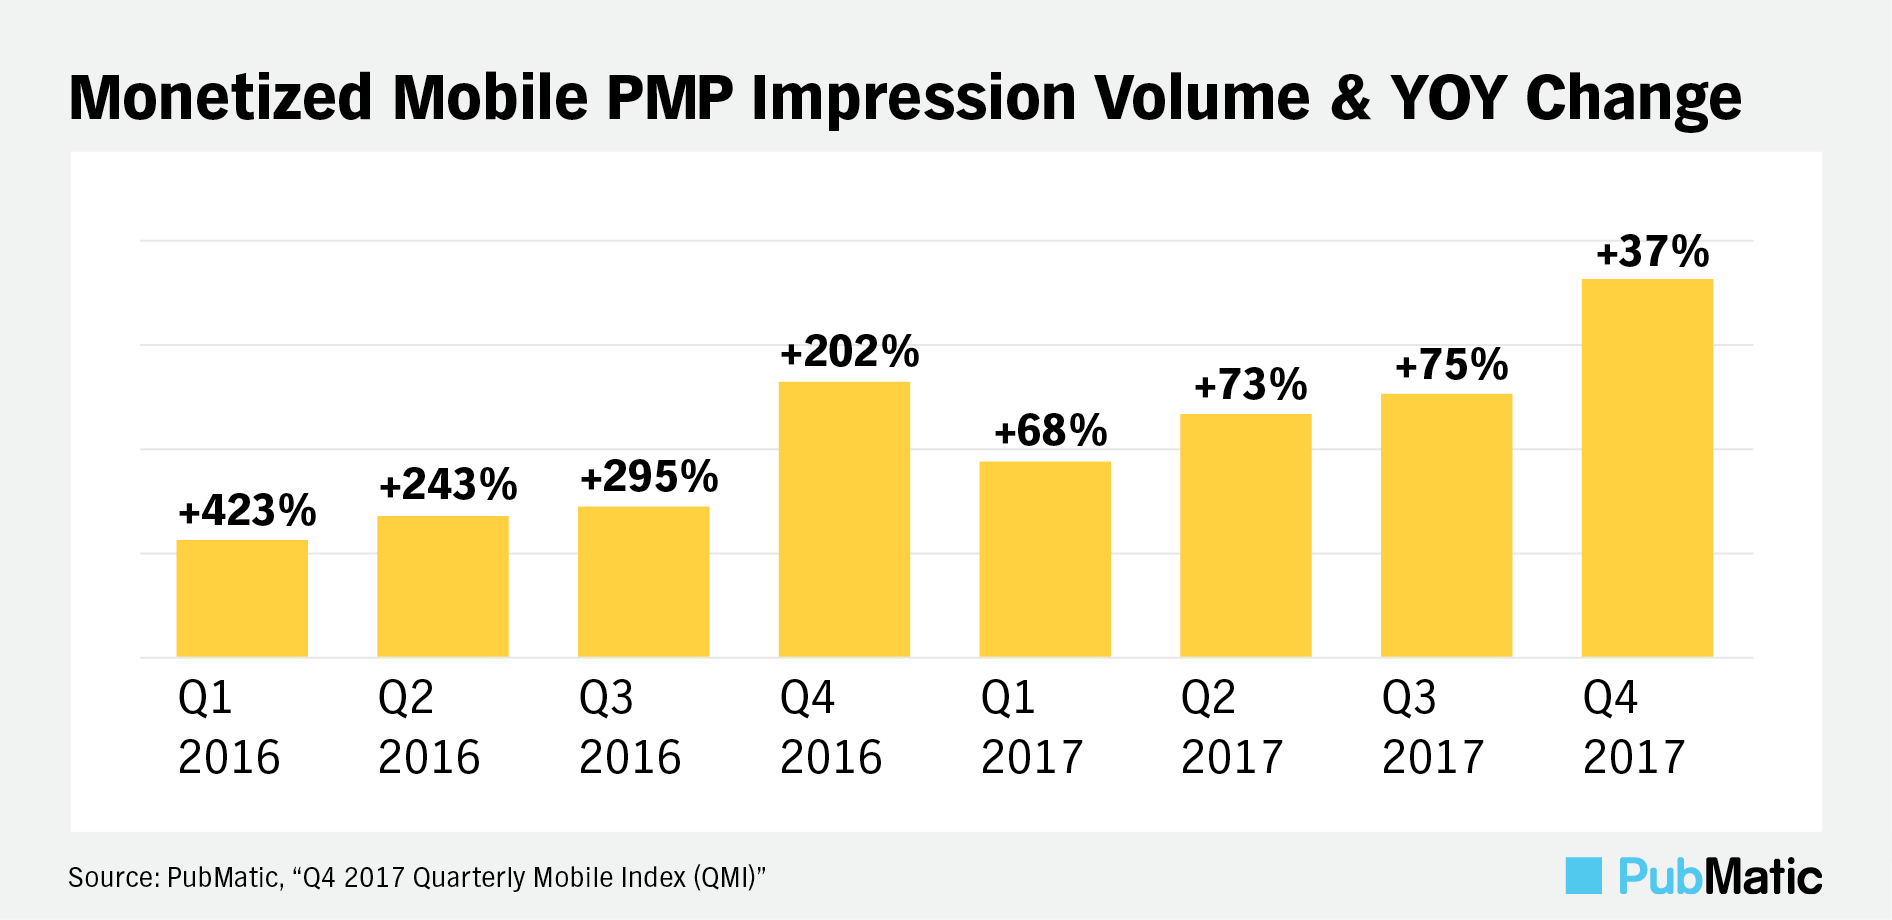
On the publisher side, mobile PMPs continued to deliver robust eCPMs; one of its most important benefits. Mobile PMPs earned 155% higher eCPMs than those paid for the average mobile open exchange impression in 2017.
Header Bidding is Now Mainstream
Header bidding technology moved into the mainstream, reaching 72% penetration among the top 1000 US publishers that monetized inventory programmatically in December 2017.3 As publishers deepened their header bidding expertise, hybrid solutions offering both client- and server-side integrations, such as PubMatic’s OpenWrap, rose from 13.6% to 20.7% adoption rate between September and December 2017.4
With uptake among publishers rising, the number of impressions monetized through the PubMatic platform using header bidding technology increased by 162% YOY in 2017, including annual volume expansions of 244% YOY for mobile web and 148% YOY via desktop.
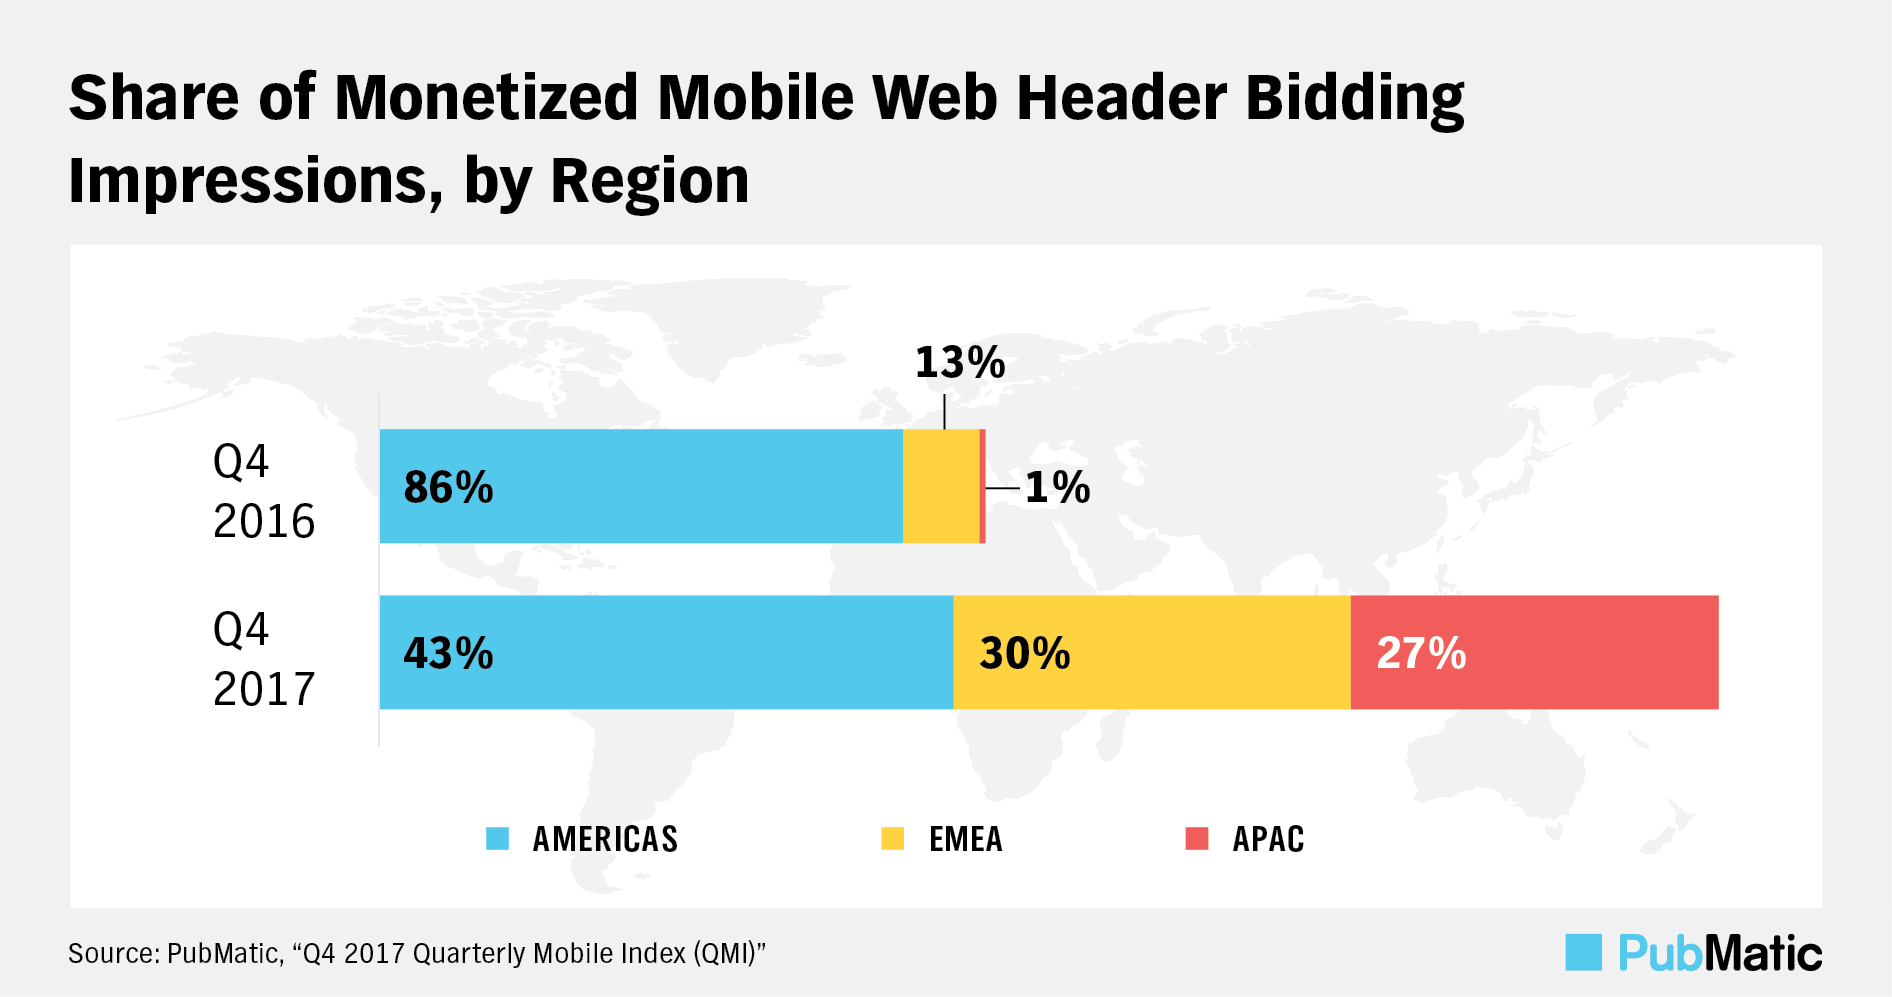
Adoption of the technology was not limited to the US and neither was its mobile volume growth. Monetized mobile web header bidding impression volume expanded fastest in APAC with a 43X YOY rise, followed by 4X YOY growth in EMEA in 2017. In the Americas, a more mature market for the technology, mobile web header bidding volumes rose 1.5X YOY. Reflecting these asymmetric growth rates, APAC and EMEA reached a combined 57% share of mobile web header bidding impressions in 2017, up from 14% a year earlier.
Mobile Video with Global Footprint
Growing mobile video consumption thrusted publishers into the channel and attracted advertisers. US adults spent an average 77 minutes per day watching digital video in 2017, nearly half of that time on mobile.5 To reach this audience, 83% of advertisers planned to increase their video ad spend in 2017. A majority of that group (72%), intended to shift spend from broadcast and cable TV to digital video, with 71% earmarking that budget for mobile video.6
Mobile took a 24% share of video impressions monetized through the PubMatic platform in Q4 2017, up from 16% the same quarter a year prior. From a global standpoint, the Americas remained the largest region for mobile video monetization, taking a 51% share of the worldwide volume in Q4 2017. Faster growth in EMEA and APAC raised their combined share of mobile video impression volume from 20% in Q4 2016 to 49% in Q4 2017.
Q4 2017 QMI Infographic
We’ve summarized the key findings from our latest QMI in the infographic below, and you can download the full report here. Be sure to check back in a few months for our Q1 2018 Quarterly Mobile Index or let us know how we can partner with you in the meantime.
[1]“Header Bidding Industry Index,” ServerBid, January 2018
[2]“Brand Protection From Digital Content Infection – Safeguarding Brand Reputation Through Diligent Ad Channel Selection,” CMO Council and Dow Jones, September 2017
[3]“Header Bidding Industry Index,” ServerBid, January 2018
[4]“Header Bidding Industry Index,” ServerBid, January 2018
[5]“US Time Spent With Media: eMarketer’s Updated Estimates for 2017,” eMarketer, October 2017
[6]“Digital Video Insights,” AOL Advertising, now an Oath subsidiary, April 2017