

With over 13 trillion advertiser bids flowing through our platform each month, the PubMatic team can identify leading and real-time trends that link to broader digital market developments. We analyze this data to anticipate market changes, and help advertisers and publishers unleash the power of programmatic within the mobile channel. These trends are reported in our Quarterly Mobile Index (QMI), which highlights the key drivers to mobile ad monetization.
The Q3 2019 QMI shines the spotlight on the top countries driving mobile ad spending, mobile video ads’ rise to market dominance, and header bidding’s expansion to mobile in-app.
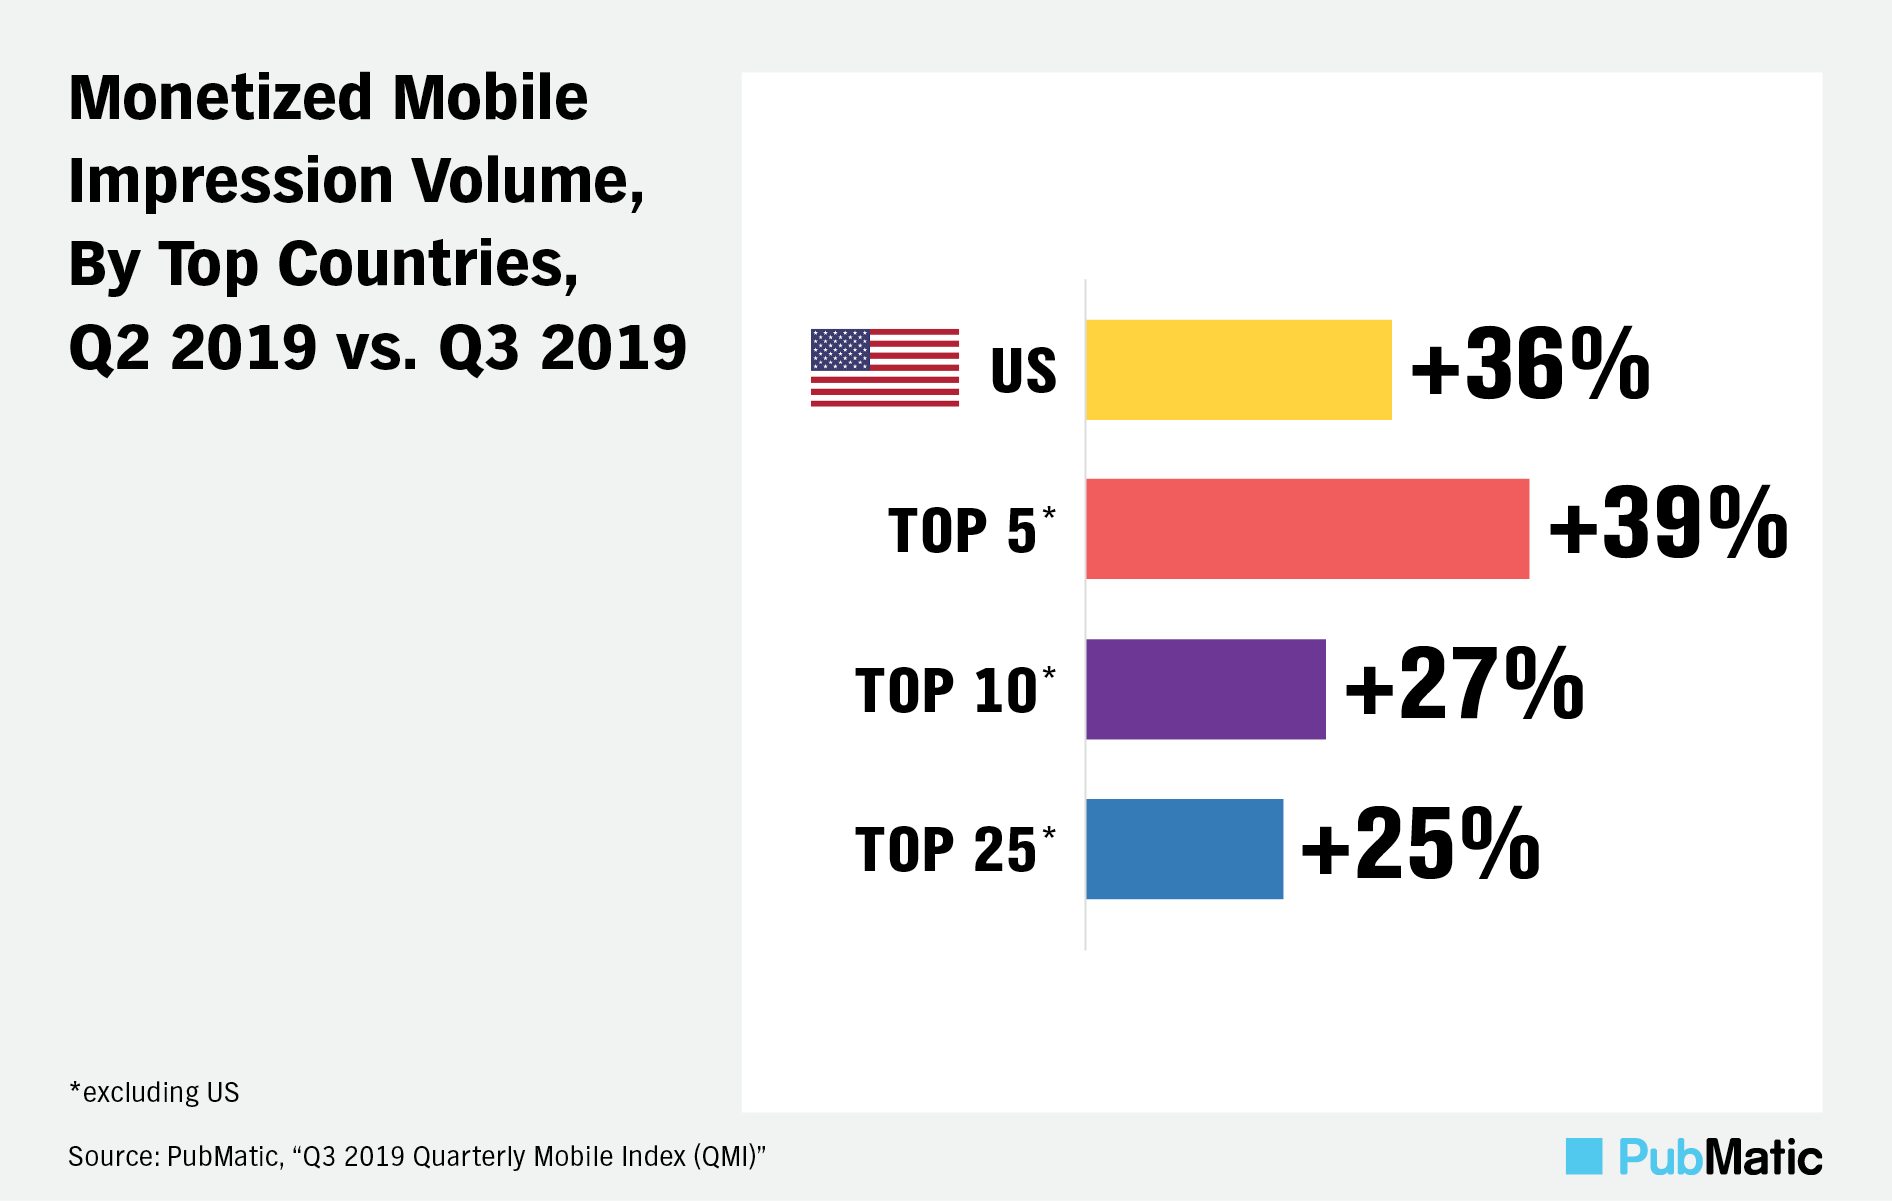
Top Global Markets Continue To Drive Mobile Ad Buying
US is setting the pace for how programmatic buying is evolving overall. US mobile ad volume grew 36% over last quarter, and the following top five countries grew even faster – increasing at a combined 39% quarter-over-quarter. With the top global markets – such as UK, Canada, Germany, Japan, etc. — still expanding rapidly, the monetization opportunity looms large when the rest of the world follows suit.
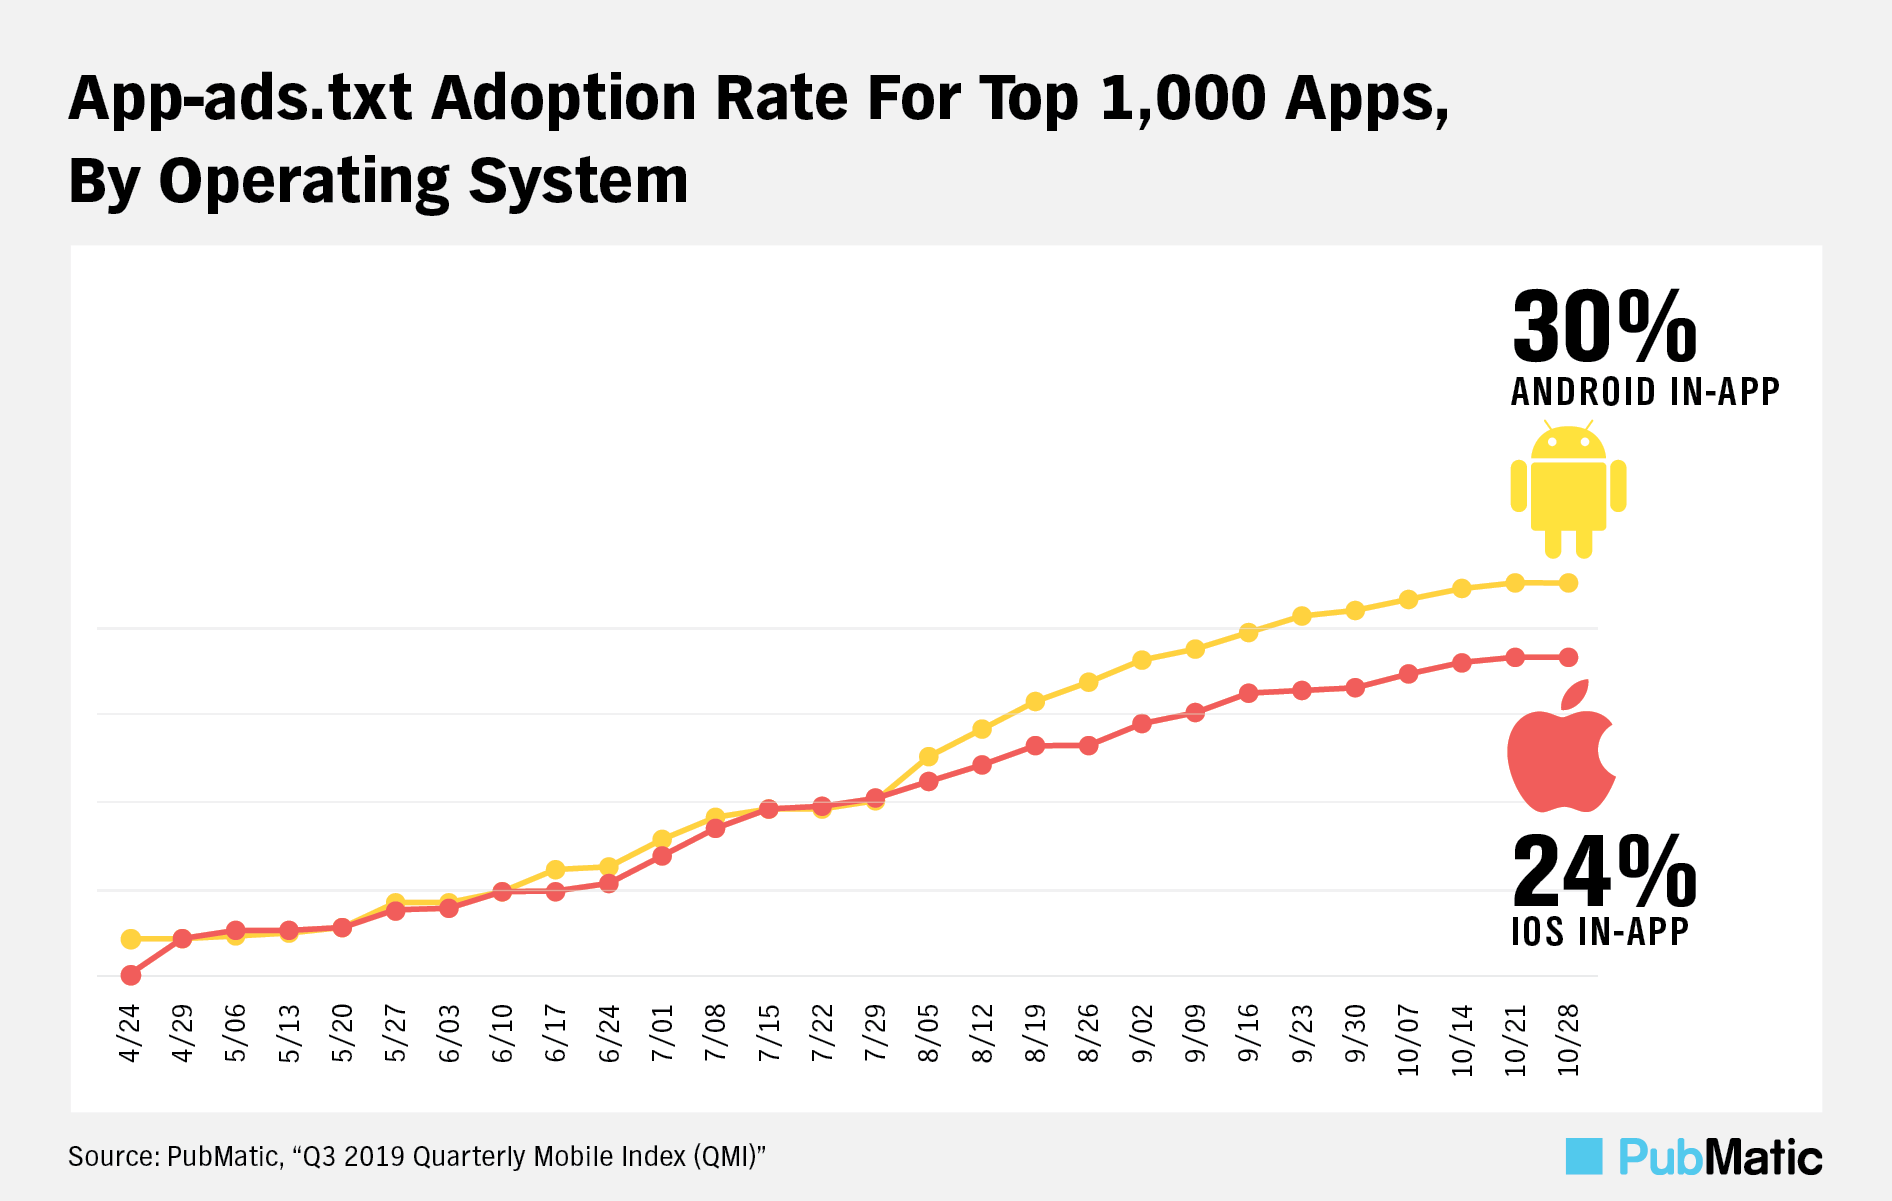
Mobile Header Bidding Is Now Standard Practice
Header bidding has reshaped programmatic advertising worldwide. While it is popular with desktop and mobile web ads, it did not gain momentum in-app until recently. Thanks to industry initiatives like app-ads.txt to eliminate fraud and the high pace of mobile development, header bidding is finally expanding into the app environment.
Full Q3 2019 QMI Report
Download the full Q3 2019 QMI report here. Stay tuned for our Q4 QMI report in a few months. In the meantime, check out our mobile solutions or reach out to discuss how we can partner with you.
QMI Methodology
PubMatic’s yield and data analytics team analyzes over 13 trillion advertiser bids on a monthly basis, utilizing the company’s best-in-class analytics capabilities. The Q3 2019 QMI incorporates impressions, revenue and eCPM data from these reports to provide a high-level analysis of key trends within the mobile advertising industry. Data is from the third quarter of 2019 (i.e., July 1, 2019 to September 30, 2019), as well as the corresponding prior year periods. Analysis is based on PubMatic-sourced data except as noted. Percentages in some figures may not sum to 100 percent due to rounding. “Monetized impressions” or “paid impressions” are defined as impressions that were sold through the PubMatic platform, and “eCPM” is defined as the cost per one thousand impressions.