

Every quarter, our team analyzes over 13 trillion advertiser bids flowing each month through our platform. This allows the PubMatic team to identify leading and real-time trends that allude to broader digital market developments. We analyze this data in context to other published information to fully understand and anticipate changes in the mobile landscape. These trends are captured in our Quarterly Mobile Index (QMI) to help provide actionable insights to enhance media and strategy planning for our advertisers and publishers.
Findings from our Q2 2019 QMI report show the programmatic ecosystem push towards greater mobile inventory quality and buyer transparency. The mobile in-app environment is at the forefront of driving this growth. This report puts the spotlight on the APAC region, PMPs, the impact of recent industry initiatives to clean up fraud, and in-app spending during political events in the United States.
Mobile Marketers Direct More Spending In-app: Unlocking Incremental Revenue
Roughly half of the global in-app ad inventory comes from the North Americas region. While this region commands the majority share, the pace in APAC is accelerating. Industry analysts expect the North American mobile programmatic media spending share, inclusive of in-app, to fall 4 percentage points by 2022 as APAC continues to expand.[1] For the first time, APAC surpassed EMEA as the second largest region for in-app ad impressions in Q2 2019; APAC now accounts for over a quarter of the global inventory. In terms of approach, we see much of the in-app inventory rapidly growing through PMPs; mobile in-app PMP volume increased by 69% in Q2 2019 year-over-year, after almost tripling the previous year. This shift is swinging inventory from the open market amid fraud concerns last year. 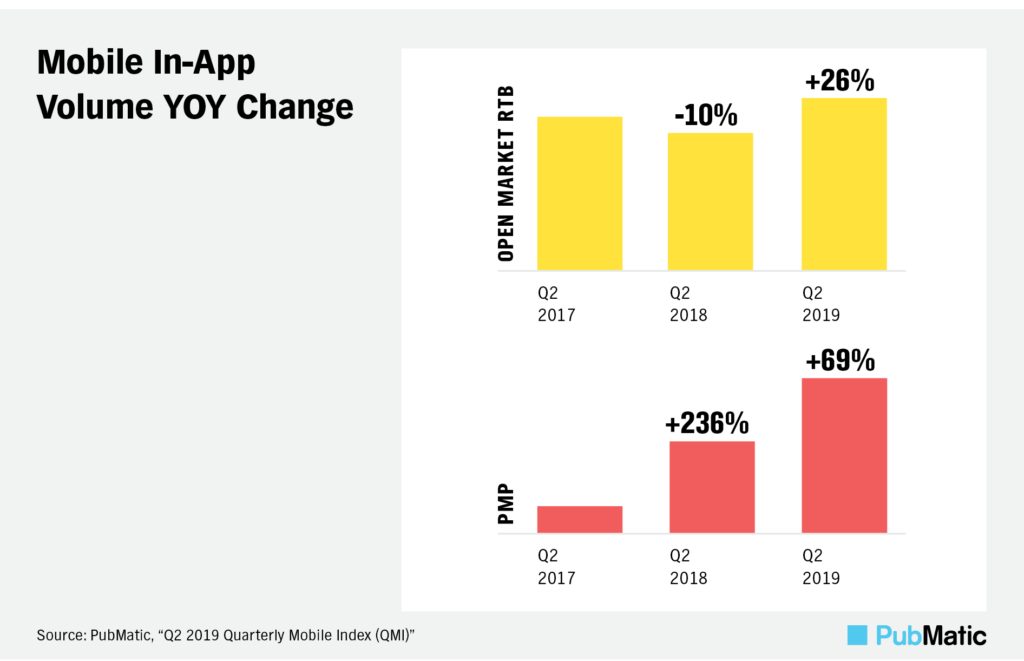
Promising Trends In Fighting Fraud
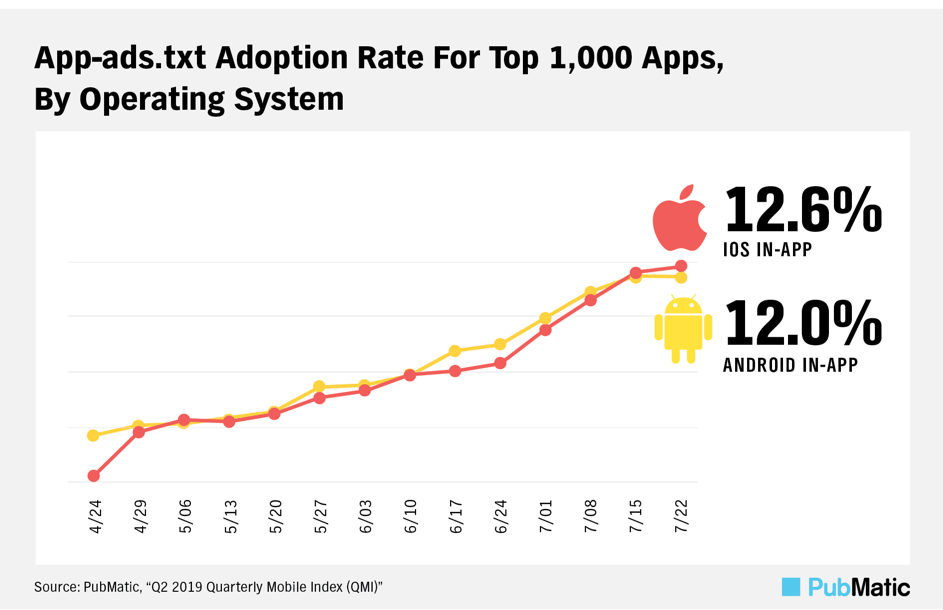
Recent efforts to combat app fraud culminated in the IAB’s release of the app-ads.txt specification this March, which facilitates better transparency for buyers within the mobile in-app environment.[1] Roughly 12% of the top 1000 industry apps published app-ads.txt files as of mid-July 2019 – an impressive growth from 0% in a matter of weeks.
Full Q2 2019 QMI Report
Download the full Q2 2019 QMI report here and stay tuned for our Q3 QMI report in a few months. In the meantime, check out our mobile solutions or reach out to discuss how we can partner with you.
[1]“MAGNA Advertising Forecasts,” Magna, Fall 2018
[2] “IAB Tech Lab Authorized Sellers for Apps (app-ads.txt),” IAB, March 2019
QMI Methodology
PubMatic’s yield and data analytics team analyzes over 13 trillion advertiser bids on a monthly basis, utilizing the company’s best-in-class analytics capabilities. The Q2 2019 QMI incorporates impressions, revenue and eCPM data from these reports to provide a high-level analysis of key trends within the mobile advertising industry. Data is from the first quarter of 2019 (i.e., January 1, 2019 to March 31, 2019), as well as the corresponding prior year periods. Analysis is based on PubMatic-sourced data except as noted. Percentages in some figures may not sum to 100 percent due to rounding. “Monetized impressions” or “paid impressions” are defined as impressions that were sold through the PubMatic platform, and “eCPM” is defined as the cost per one thousand impressions.