

Logs are like the heartbeat for any application or system. If you start skipping these heartbeats, your system might become distressed. By reviewing and analyzing logs, you can confirm if everything is healthy and working well within your ecosystem. Logs are important because they are often the first entry point a support engineer checks to understand the state of service and identify a problem.
Whenever we talk about a distributed scalable environment, the primary focus is on the distribution of requests and utilizing the infrastructure in the most efficient manner. Logs are a primary indicator of the health of a system and they provide a starting point for investigations when an issue is detected.
By improving log management, PubMatic is able to provide a more stable platform for our customers and decrease the time needed to find and fix any issues. Ultimately, this results in a better client experience as there is less down time and faster fixes. Take a look at what we have done to address issues in log creation and how we have streamlined our log management.
Potential Problems with Inefficient Log Creation

With the growth of microservice architecture, the problem of log collection may grow exponentially as you scale horizontally on components. Hence problems can creep in including the following:
- Volume/Scale
- Even with just 10 microservices, providing system and application information from 1,000 servers and capturing just 4 packets per second, it can become unmanageable. The number of log lines would grow to around 3 billion log lines per day. Unless you are super human, analyzing 3 billion logs per day is impossible.
- Analytics/Anomaly detection
- As mentioned above, due to the scale of data, it’s difficult to analyze everything, thus tools are necessary to make sense out of the logs. This includes aggregated dashboards which show better views of the collected data. Also, these tools can alert system admins when an anomaly or suspicious behavior is detected.
- Security/Access Control
- All data needs to be protected from unauthorized access. This is obvious and generally understood but it doesn’t hurt to mention. As a general rule, in addition to general protective measures, developers should also have access to production servers. If access is required it should be justified, approved for a defined period of time and then auto-revoked and auditable.
- Searching/Filtering
- With a little Linux knowledge, it is possible to easily query very large files in GBs to find relevant information. But this might not be the case for all developers. Therefore, it is important to provide a search interface, with advanced filtering and sorting capabilities.
- Alerting
- It is more efficient to push alerts to appropriate channels, rather than rely on polling information, in case something unusual is detected.
Centralized Log Management
Typically, large companies use orchestration frameworks, like Kubernetes, to scale microservices using containers. This adds a transient nature to containers (i.e. containers created/destroyed depending on need and load). This can ultimately result in a loss of logs if they are not pushed to a central location.
With the above challenges in mind, at PubMatic, we started exploring options around centralized logging to tackle the known issues as functional/non-functional requirements.
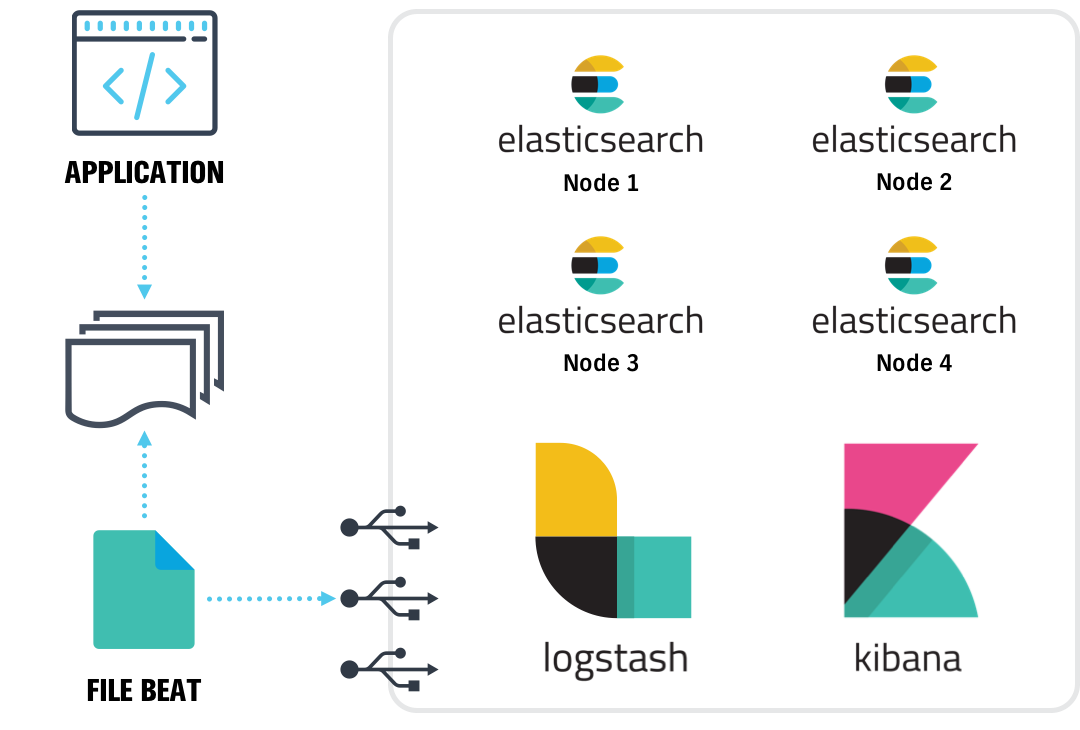
We started investigating a couple of tools in-market and performed additional industry research. Afterwards, we carried out a proof-of-concept (POC) with a couple of services and used ELK Stack (Elasticsearch, Logstash, and Kibana) to collate logs from various service containers/nodes. A similar setup would look like this:
Set Up Details
For setup, we started by using Docker to try out the POC. Docker provides us with the control to pull an environment up and down easily while trying out certain options. Later we moved to clusters using swarm. This allowed us to scale as required by adding more nodes to the swarm cluster. We made sure to track access logs and application logs separately. We chose to do this because access logs can tell a lot about how users are using your platform; conversely, application logs tell you how applications are responding to user behavior.
By structuring our log management this way, it means we can track both anomalies and user behavior which clues us in on the quality of a product. By having these two types of clusters, we were able to detect the patterns in access logs and find the root cause from our application log cluster.
Some additional actions we took included using Logstash to parse the logs before they were pushed into Elasticsearch. We also deployed Filebeat and Metricbeat to collect information about the application and system (beats are light-weight data shippers which can handle the back-pressure).
We currently process billions of logs across both of our clusters. We can query the required data more effectively now and share everything with developers to take action upon through dashboards and short-URLs. PubMatic also has an alert system to notify us about unusual behavior using channels like email and Slack.
We are now performing additional optimizations to increase the capacity of existing clusters and use our setup more effectively in a cross-data center environment.
Overall, a project which started out as small POC was than transformed into a system which was very helpful in getting details around applications without making a single code line change in any application itself.
Want to know more?
PubMatic is passionate about pursuing innovation and creating efficient infrastructures for our clients. By improving our log management, we have a more stable platform and a better user experience for our clients. Our teams will be posting regular updates on what we are doing to solve pain points and address industry concerns. Stay tuned as we work and contact us if you have specific questions.